Overview - Business Intelligence
View, analyze, predict: all in a single platform
The AIDA Overview revolutionizes document and data management with a fully customizable, widget-based dashboard.
Add, resize, and position widgets to visualize real-time analytics, monitor activities, and access advanced business intelligence tools.
Leverage dynamic charts that automatically update with new document uploads, and unlock predictive insights through trend analysis and seasonal forecasts.
From monitoring ROI and time savings to managing payments with AIDA Pay, Overview integrates seamlessly into your workflow.
Transform raw data into actionable insights and stay ahead with a platform designed for efficiency and strategic growth.
The perfect foundation for Business Intelligence
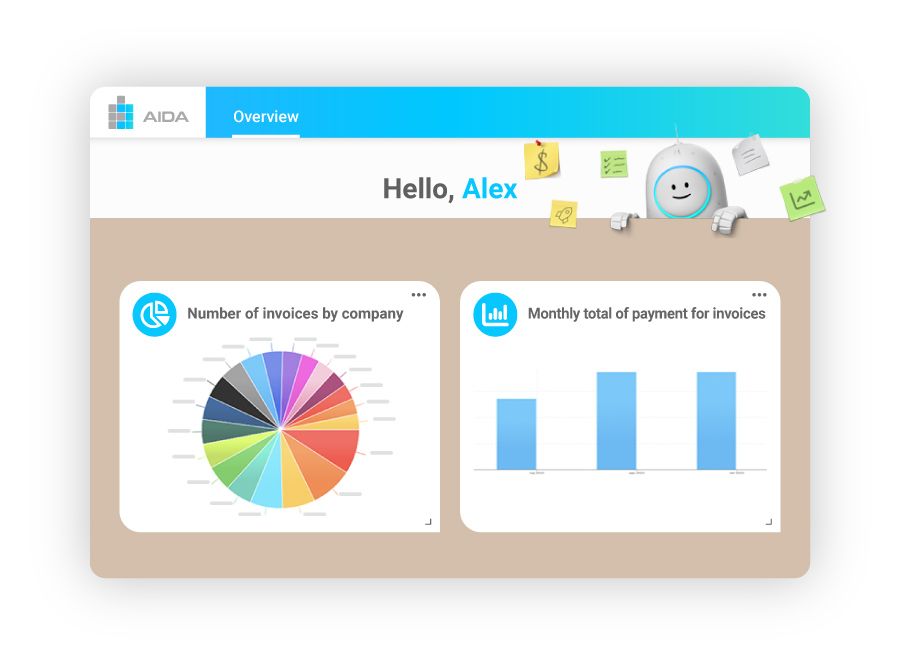
With AIDA, Business Intelligence originates from Document Management.
Data extracted from documents are normalized and organized, eliminating duplicates and ensuring a clean and reliable database. This structure allows for the creation of reports and analyses without the need for complex manual interventions.
Thanks to data integration, you can monitor KPIs, analyze trends, or compare historical metrics with utmost ease. For example, quickly identify your most profitable customers or analyze operational costs to optimize your business strategy.
The certainty of having up-to-date data in real time, without errors or duplications, allows you to save time and focus your resources on strategic decisions, turning every document into a valuable asset.
Dynamic and easy-to-create charts
Creating charts with AIDA does not require technical skills.
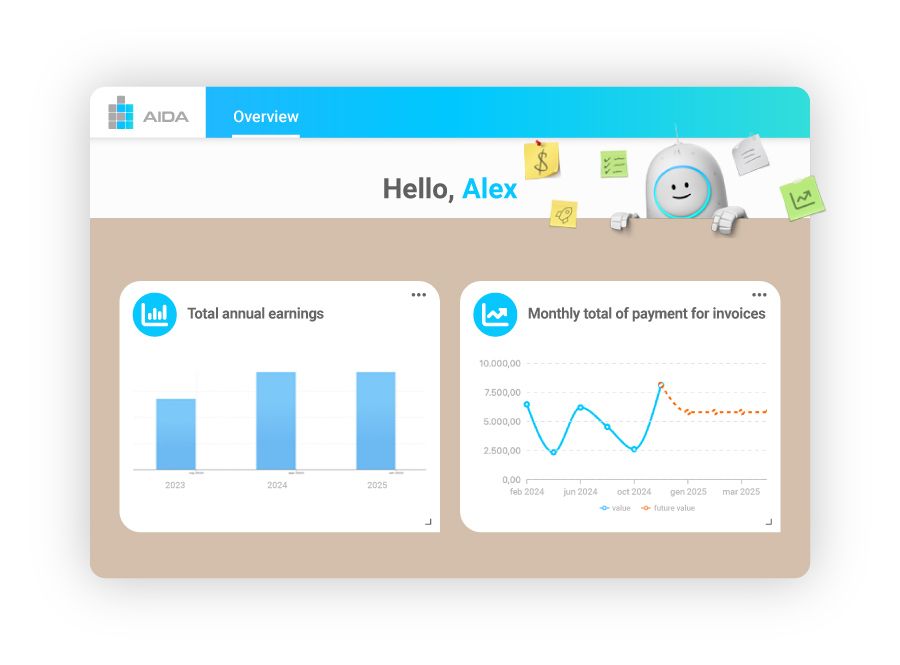
With just a few clicks, you can choose from pie charts, bar charts, line charts, and data aggregations to visually represent your insights.
Each chart is intuitive and immediate, designed to adapt to the needs of each user.
For example, you can create a chart that displays total revenue per customer, automatically updated every time you upload new documents.
Alternatively, you can monitor the progress of your contracts, quarter by quarter.
Automatic updating ensures that your charts are always in line with the latest data status, eliminating the need for manual intervention.
This is an invaluable advantage for anyone who wants to make quick and informed decisions.
Anticipate the future with historical data
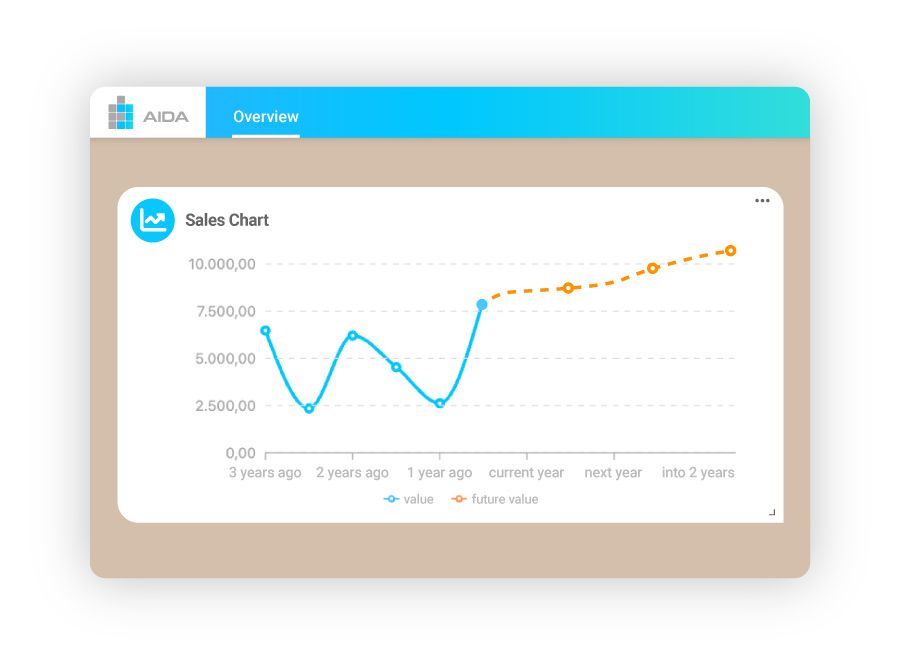
AIDA's charts do not merely represent the present but also analyze historical data to provide forecasts about future trends.
This system leverages the evolution of historical data to identify patterns, trends, and seasonality, allowing you to precisely plan your next moves.
For example, a retail company can predict sales spikes during the holiday season or identify slow periods to optimize inventory.
Similarly, in the service sector, you can anticipate periods of high demand and allocate resources more efficiently.
Thanks to these forecasts, based on intelligent algorithms that learn from your data, you will never be unprepared for market changes.
AIDA enables you to transform Business Intelligence into a proactive tool, optimizing management and reducing the risks associated with decisions made in the dark.
Manage payments directly from your dashboard
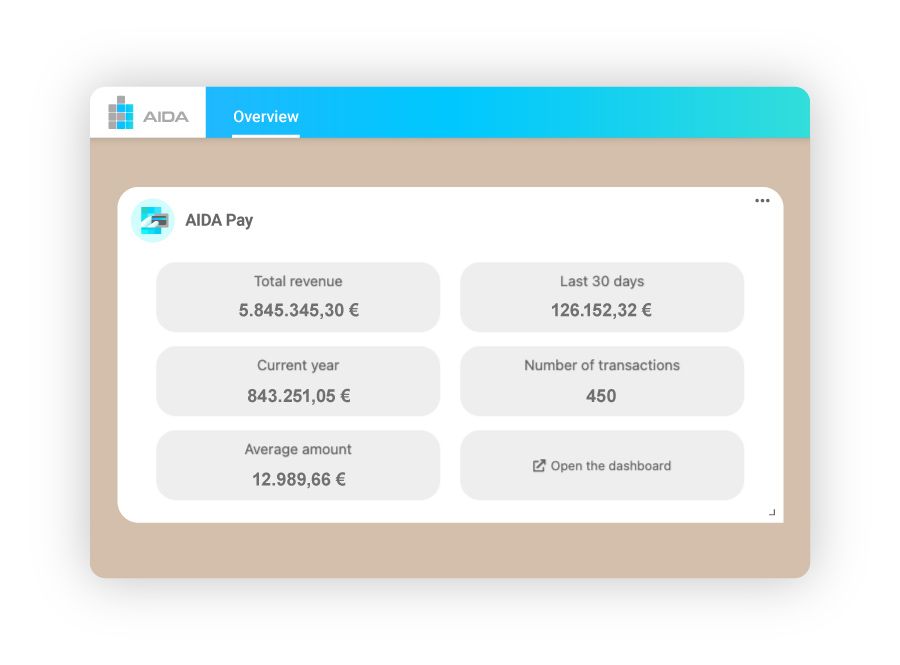
The AIDA Pay widget offers a clear and comprehensive overview of received, pending, and anticipated payments.
You can monitor each transaction and access tools for automatic reconciliation.
For example, view payments collected per customer or by date, or use the data to forecast cash flow.
Everything is seamlessly connected to related documents, eliminating errors and simplifying financial control.
With AIDA Pay, you transform every document into a window into your finances, combining document management and transactions into a single integrated solution.
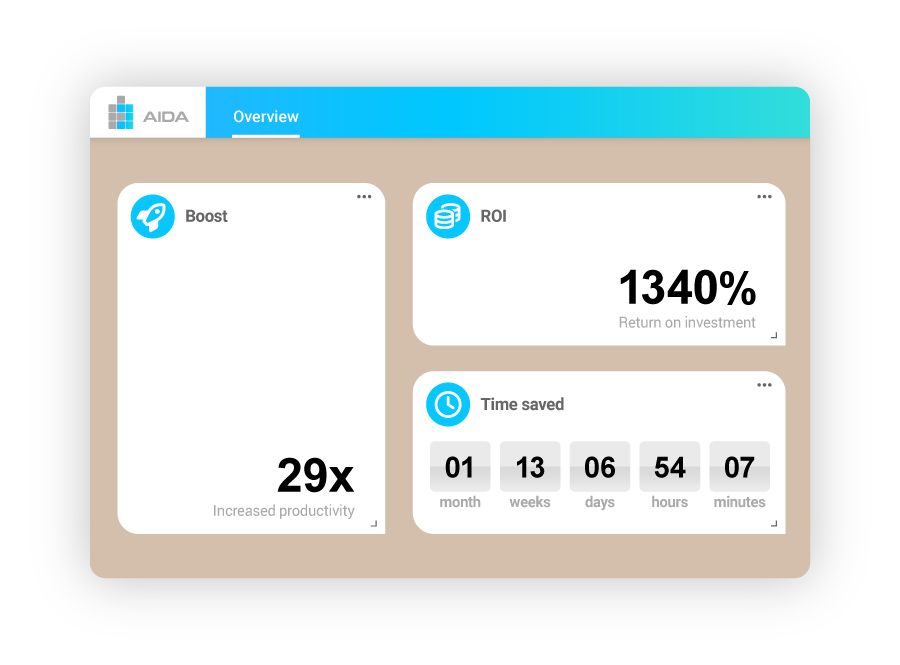
Measure the impact of AIDA on your productivity
With the Boost, ROI, and Time Saved widgets, you can quantify the benefits of your investment in AIDA.
Discover in real time how much time you've saved compared to manual processes and calculate the economic return generated by automation.
For example, a user who uses AIDA daily can save hours each week, improving the overall efficiency of the team.
The widget provides tangible data that highlights the added value of the platform.
These tools allow you not only to monitor progress but also to identify areas for improvement to maximize the return on investment.


